
Session-1: Overview & Features of Sheets
29-07-2023 at 01:30 pm
Previously live
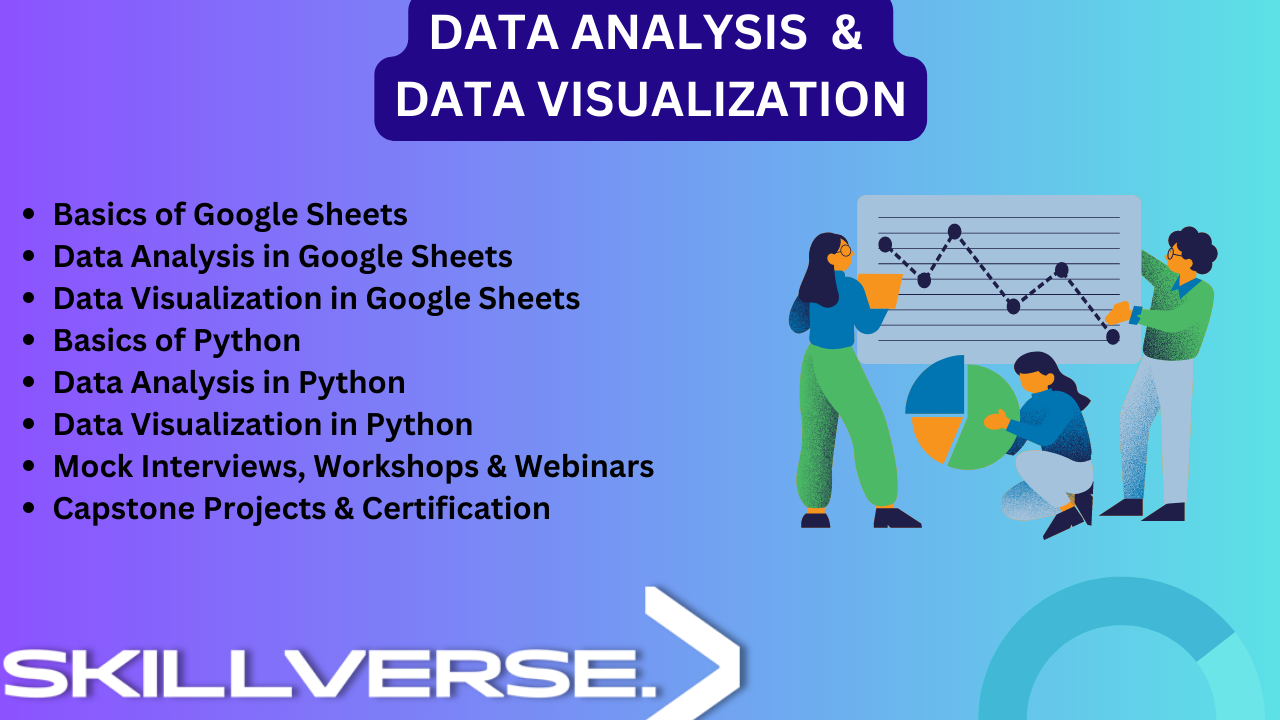
Module-1 : Data Analysis in Google Sheets:
In this module, you will learn how to leverage the power of Google Sheets to extract, clean, and manipulate data. You will explore various data analysis techniques, such as filtering, sorting, and using formulas and functions to derive meaningful insights from your data.
Module 2: Data Visualization in Google Sheets:
In this module, we will discover how to create dynamic dashboards and reports that present data in a visually appealing and easily understandable format.The program will cover key topics, including data importing and exporting, data cleaning and transformation, exploratory data analysis, statistical functions, data visualization techniques, and more. You will also have the opportunity to work on real-world projects and gain hands-on experience in analyzing and visualizing data using Google Sheets.
Module 3: Data Analysis in Python:
In this module, you will delve into various data manipulation and analysis techniques, mastering Python libraries such as Pandas and NumPy. You will learn how to clean and preprocess data, apply statistical methods, and perform exploratory data analysis to uncover valuable trends and patterns.
Module 4: Data Visualization in Python:
Additionally, you will harness the power of Python's visualization libraries, such as Matplotlib and Seaborn, to create stunning visual representations of your data.
Capstone Project:
Through hands-on projects and real-world case studies, you will refine your skills in data cleaning, manipulation, statistical analysis, and visualization. You will gain a comprehensive understanding of how to effectively communicate data insights through visually compelling charts, graphs, and dashboards.
By the end of the program, you will have a solid foundation in data analytics and data visualization in Google Sheets. You will be able to confidently analyze data, uncover patterns and trends, and create compelling visualizations that effectively communicate your findings. These skills are highly valuable in various fields, such as business, marketing, finance, and research, where data-driven insights drive decision-making.
By completing the Data Analytics & Visualization in Python program, you will unlock a wealth of opportunities in the data-driven world. Whether you aspire to excel in data science, business analytics, or any field that requires data-driven decision-making, this program equips you with the essential skills and knowledge to succeed.
Enroll now and embark on a transformative journey, where Python, data analytics, and visualization converge to unleash the full potential of data and drive your professional success. Join the Data Analytics & Data Visualization in Google Sheets program and unlock the power of data to gain a competitive edge in today's data-driven world. Expand your skill set, enhance your career prospects, and make informed decisions based on solid data analysis and visualization techniques